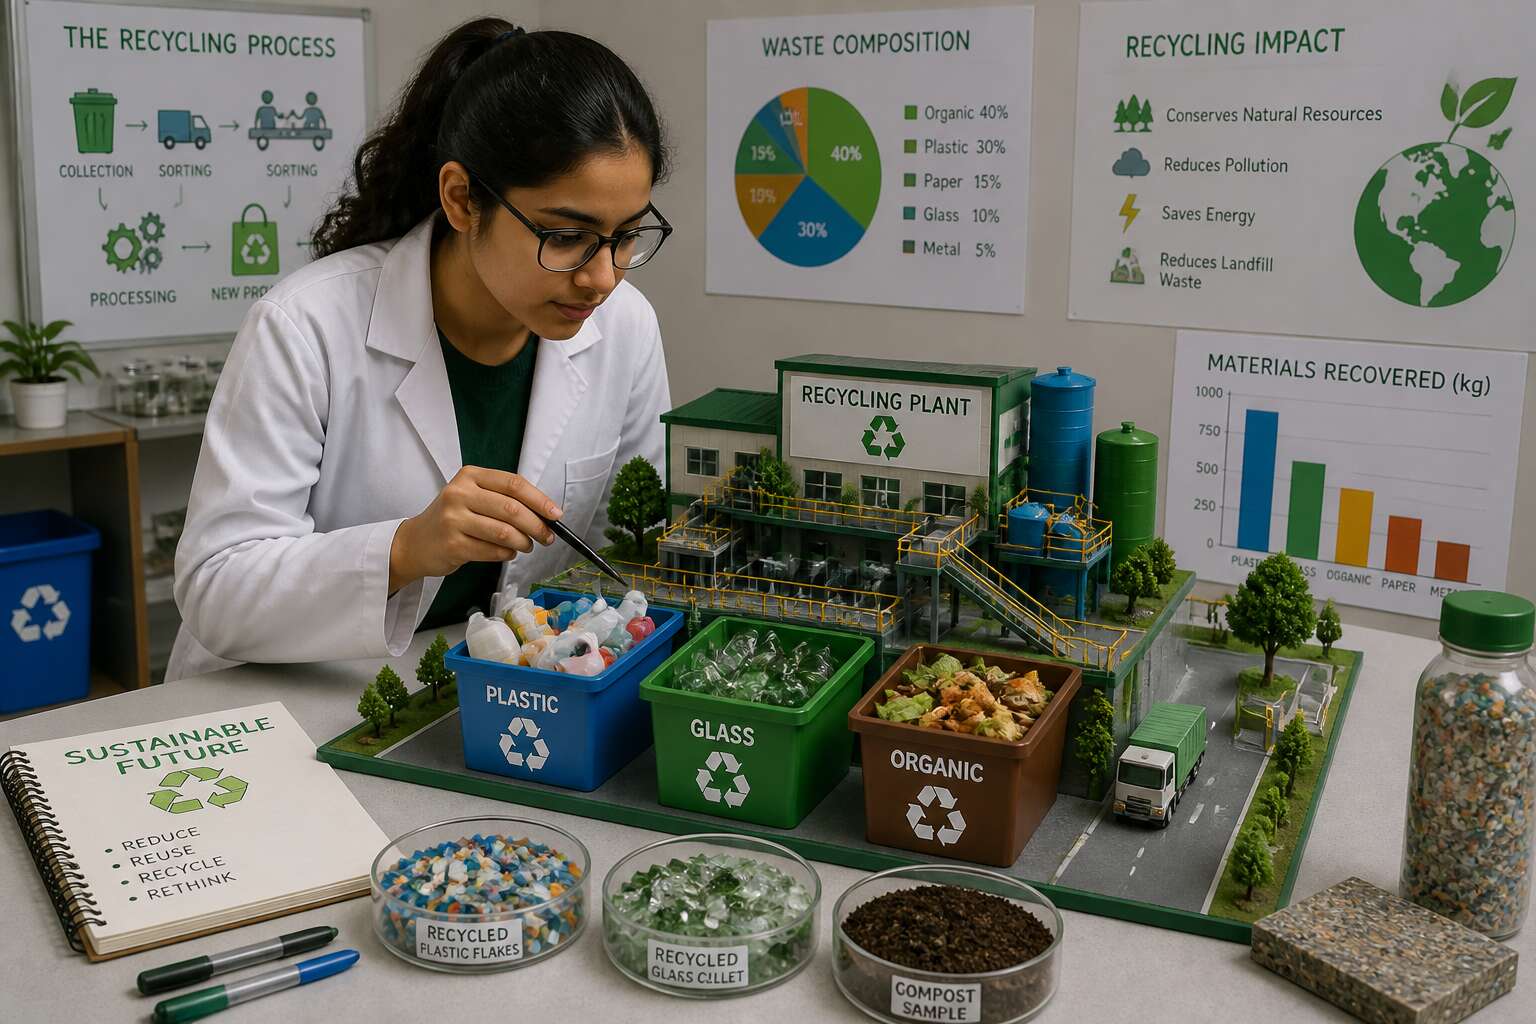
Foundational Knowledge for Eco-Friendly Experiments
Classifying Household and Organic Waste
In South Africa, roughly 10% of general waste avoids the landfill. That sobering statistic explains why every waste management science project begins with classification. Understanding what sits in the bin is the first step in eco-friendly experimentation. I have watched learners confuse organic matter with ordinary rubbish, and that single error derails everything.
Household waste divides into organic matter and inorganic refuse. Organic waste, such as fruit peels and vegetable trimmings, is putrescible. It rots quickly and releases methane under anaerobic conditions. Inorganic refuse, including glass, metal, plastic, and paper, behaves differently. Three principles anchor this foundational knowledge:
- Separation prevents cross-contamination.
- Decomposition rates dictate handling.
- Moisture content changes what a material becomes.
These principles turn a waste management science project from guesswork into a reliable methodology. Classification gives every experiment a clear starting point.
How Decomposition Works in Landfills
Beneath the surface of every landfill, a hidden chemical theatre unfolds. When organic waste is buried without oxygen, methanogenic microbes initiate a slow, anaerobic digestion process. This is a cornerstone concept for any waste management science project focusing on environmental impact. The decomposition rate depends heavily on moisture and the composition of the buried layers.
This biological breakdown produces a complex cocktail of gases. The primary outputs are methane and carbon dioxide, both potent greenhouse gases. Understanding this gaseous release is crucial for designing experiments that measure emissions or test mitigation strategies.
The main gases generated in a landfill include:
– Methane (CH₄)
– Carbon dioxide (CO₂)
– Trace amounts of hydrogen sulfide
A well-designed waste management science project will account for these variables to ensure accurate data collection. The chemical transformation is slow, often taking decades for complete stabilization.
The Environmental Impact of Improper Disposal
The true cost of improper disposal does not appear on municipal invoices. It surfaces later, in contaminated boreholes and degraded soil. For any waste management science project, this unseen cost is the starting point. You need foundational knowledge about material behavior.
Improper disposal does more than create litter. It creates chemical pathways. Rain filters through dumped waste, producing leachate that carries heavy metals into groundwater. These contaminants move through aquifers, undetected until a community’s water supply testspositive for e. coli or lead.
- Leachate conductivity across seasonal rainfall periods
- Soil macroinvertebrate diversity near informal dump sites
- Borehole water pH and nitrate levels
These measurements provide evidence. They also reveal why location matters. For an eco-friendly experiment to hold value, you must establish baseline conditions. A waste management science project that ignores geology, hydrology, or climate data will produce misleading conclusions. Understanding your site’s baseline conditions is non-negotiable!
Understanding the Role of Microorganisms in Breakdown
Beneath every compost heap and landfill cell, a hidden economy thrives. Microorganisms perform the quiet, relentless labour of transformation, converting complex polymers into simpler molecules. This process is fermentation, a biological alchemy that turns waste into resources. For any waste management science project, the diversity and metabolic activity of these microbial communities dictate the speed and efficiency of breakdown. When conditions are right, even recalcitrant materials yield to enzymatic action. When they are not, the process stalls, and waste remains inert for decades.
Certain variables influence microbial efficacy more than others. A successful experiment hinges on their careful observation.
– Oxygen availability, which determines whether decomposition follows an aerobic or anaerobic pathway
– Carbon to nitrogen ratios, which govern the nutritional balance for microbial populations
– Moisture content, which affects the mobility of enzymes and nutrients
A waste management science project must account for these factors to produce meaningful data. The living world of microbes is not a black box. It is a measurable, responsive ecosystem that reacts to every input you provide.
Selecting an Impactful Project Concept
Building a Mini Composting Bin
Organic waste sits in South African landfills for decades. A small bin can change how a student sees that process. Selecting an impactful concept for a waste management science project begins with building a mini composting bin. The container is modest, yet the questions it raises about scale and material choice are not!
The construction asks for clear decisions:
- A transparent plastic container
- Shredded paper for the brown layer
- Vegetable peels for the green layer
- Drilled holes for airflow
Each decision links to the larger system. The bin captures moisture before it becomes odour. It separates food scraps from the trash bag, turning a daily disposal habit into a visible cycle. I have watched learners lean closer to inspect the dark crumbles of finished compost, and that moment often triggers a deeper interest in the waste management science project. This project concept works because it is tangible, repeatable, and honest.
Testing Recyclable vs. Biodegradable Materials
In South Africa, recyclable and biodegradable labels often compete for the same bin. Testing these materials side by side gives a student a direct look at how packaging claims hold up under real conditions. Place a recyclable plastic bottle and a biodegradable takeaway container in identical conditions. Observe them weekly. Record weight loss, structural change, and visible breakdown.
- Recyclables often resist decomposition entirely
- Biodegradables may fragment into microplastics or disappear completely
This comparison forces a deeper question about the waste management science project. It reveals that a label is not a solution. It is a promise, one that depends on infrastructure. The student learns to read the gap between intention and outcome.
Investigating Waste-to-Energy Models
South Africa’s energy crisis and overflowing landfills are two headaches that deserve each other. A waste management science project investigating waste to energy models turns this pairing into a powerful experiment. Instead of just sorting rubbish, a student can ask whether our trash can actually power our homes.
The core question is simple: can we burn or process waste to create usable electricity? For this project, build a small, controlled setup. Use a metal container and a heat source to test the calorific value of different waste types. Measure the energy output and compare it to the mass of the waste. This creates a direct, measurable result.
Consider tracking several variables:
1. The temperature reached by each material.
2. The duration of the burn.
3. The ash residue left behind.
This approach reveals a hard truth about thermal treatment. It is not a magic bullet. The energy conversion is real, but so is the emissions problem. Plastic, for example, burns hot but releases toxic fumes. Organic waste produces less energy and more smoke. The student learns that a waste management science project focused on energy is a study in tradeoffs.
The real insight comes from the sorting challenge. To make waste to energy work, you need a feedstock that is consistent. That means removing hazardous materials and non combustible items. This forces a student to design a mini pre sorting line. It is a lesson in systems thinking, proving that the energy output is only as good as the input quality. The experiment highlights that infrastructure is the deciding factor.
Creating a Low-Cost Water Filtration System
Water filtration might sound like a plumbing lesson, but it is a clever way to repurpose discarded materials. A waste management science project built around a low cost filtration system gives students a chance to transform plastic bottles, old fabric, and charcoal into a working device. The concept stands out because it addresses contaminated water and overflowing bins in one experiment. When selecting an impactful concept, look for a project that delivers visible results without fancy equipment. Ask these questions:
- Does it reuse common waste items?
- Can you measure the output quality?
- Does it teach a transferable skill?
A simple filter column with layers of sand, gravel, and cloth can turn muddy water into clearer liquid. Students compare turbidity before and after filtration. That measurable outcome makes the exercise satisfying and valuable.
Structuring a Rigorous Scientific Inquiry
Formulating a Clear Hypothesis
Every scientific inquiry starts with a question, but a waste management science project only gains direction from a precise hypothesis. Without one, your data collection wanders. I have watched learners struggle because they measured everything and understood nothing!
A clear hypothesis states the expected relationship between two variables. For example, increasing aeration in an organic pile will reduce odor intensity. You must define how to measure that odor, which conditions stay fixed, and what count proves your claim. This structure lets curiosity produce reliable evidence.
Identifying Independent and Dependent Variables
Of all the errors committed in a waste management science project, the most common is a careless shuffle between what you change and what you observe. Researchers, eager for results, often alter three things at once. The outcome is a muddle of data that represents nothing. The variable must be your instrument of change.
The independent variable is the single factor you manipulate, the one action taken. The dependent variable is the response you witnessed. For example, when testing leachate buildup, you might choose to adjust the moisture percentage. The independent variable is the water added each week. The dependent variable is the chemical concentration of the liquid collected. You withhold one variable to see if the existence of a cause is real.
Control conditions are the harsh boundaries of the test. Temperature, aeration, and even the type of container must remain fixed. A waste management science project relies on this discipline to expose the truth. Consider the metrics:
– Volume of weight reduction
– Changes in pH levels
– Duration of the decomposition phase
Each metric exists only to serve the dependent side of the experiment. If the measurement changes when you want it constant, the test is flawed. Use only what you can prove and hold fast to the standard of isolation.
Establishing Controlled Conditions
South Africa generates over 54 million tonnes of general waste each year, yet most of it decomposes without structured observation. A waste management science project requires a deliberate framework. Control conditions function as the frame for every measurement you take.
Before any experiment begins, set baseline readings. Record the starting mass, moisture content, and pH of your material. These numbers anchor the entire inquiry. Lock down the variables you will not touch.
- Ambient temperature inside the container
- Volume and composition of the waste sample
- Aeration schedule or mixing frequency
Run each trial in duplicate or triplicate. A single test proves little. Repetition reveals patterns that one container cannot show. The structure is not complicated, but it must be consistent. That consistency separates a valid experiment from a pile of anecdotes.
Listing Materials and Safety Precautions
Every rigorous waste management science project depends on a complete material list and strict safety rules. I have seen experiments fail because someone skipped a glove or used a worn scale. Start with the basics!
- Disposable nitrile gloves and a half-mask respirator
- Digital scale with 0.1 gram precision
- pH test strips and a moisture meter
- Airtight jars for sample storage
- Thermometer for container readings
Safety must come first. Organic waste can release spores, ammonia, and methane. Work in a ventilated area and never taste or sniff any material. Identify unknown waste using a reference chart before touching it. The scientific inquiry succeeds only when your equipment and your body are protected. One spill or one puncture can derail everything.
Proposing a Step-by-Step Procedure
Every rigorous inquiry needs a visible sequence of actions. Without a written procedure, your waste management science project becomes a series of improvisations. Reserve time to draft each step before handling materials.
Identify the question your project must answer. Then break that question into measurable actions. For example:
- Record initial waste mass and volume.
- Apply your chosen treatment or sorting method.
- Measure outputs at defined intervals.
Assign each interval a specific instrument and a responsible person. This removes ambiguity. The procedure should allow for deviation when evidence demands it. A step-by-step plan remains open to revision. Update the protocol when the data exposes new variables. That is where scientific maturity begins.
Collecting and Interpreting Experimental Data
Measuring Decomposition Rates Over Time
Some South African households discard an estimated 40% of their food before it ever reaches a table. That number becomes a gripping starting point for any student measuring the life cycle of organic matter. When you move past the physical building of your waste management science project, the real experiment begins. This is where patience becomes your primary tool. You are observing a slow transformation, a quiet chemical shift that unfolds over weeks.
The most direct method for charting this progression is to record mass loss. You will find that a single apple core or a handful of coffee grounds does not simply vanish. It breaks down in stages, each with a distinct signature. To capture this, establish a routine where you weigh your compost sample at intervals, perhaps every three days. Log those numbers diligently. Over time, you will see a steep drop in weight as water evaporates and soft tissues liquefy, followed by a plateau where the tougher, fibrous material resists further change.
As you track this data, you must also observe the qualitative shifts that the scale cannot measure. These are the visual and olfactory cues that tell the true story of decomposition. Watch for the sequence of events, which typically follows a predictable order:
– The initial phase: a release of moisture and a faint, earthy smell.
– The active phase: a noticeable collapse in volume, accompanied by a warmer core temperature.
– The maturation phase: a dark, crumbly texture that no longer resembles the original inputs.
Interpreting this raw data requires a critical eye. A slowing rate of decomposition does not indicate a failure. It reflects the presence of lignin and cellulose, the same structural polymers that make wood sturdy. By connecting your numerical records to these physical observations, you transform a simple science fair display into a compelling narrative about biological efficiency, one that directly informs the future of municipal waste strategy.
Observing Changes in Mass and Volume
Mass and volume rarely decline at the same rate. A pile of food scraps may hold its volume for weeks while mass steadily drops, because the structural cells trap air and water. That divergence is your most informative measurement.
When you record data for your waste management science project, track both metrics separately. Volume is trickier. A compost bin settles, but it also expands when you turn it. Use a consistent method, like marking a line on the bin wall or filling a container to a fixed level.
Consider what your measurements reveal:
– Dense weight loss without volume loss signals active microbial respiration.
– Rapid volume shrinkage suggests physical compaction, not chemical breakdown.
– Stagnant mass with growing volume means the pile is aerating, not decomposing.
Interpreting these combinations builds a richer picture than either number alone. The visible structure tells you what the scale cannot.
Conducting Comparative Tests Between Materials
Comparative testing is the core of your waste management science project. When mango peels, cardboard, and plastic film sit side by side in South African classroom bins, the differences in their breakdown timelines become impossible to ignore!
Measure every material under identical starting conditions, then observe each one separately. I have watched one sample shed moisture quickly while another holds it tight, breeding colonies that demand an entirely different interpretation.
The key is reading patterns, not single readings. A waste management science project succeeds when your data collection adapts to what each material reveals, without compromising the comparison. Track variables that shift between samples:
– Temperature fluctuations inside each test container
– The ratio of surface area to mass in shredded versus whole pieces
– Leachate production and its effect on measured weight
A single dramatic result rarely tells the whole story; the quieter data sitting next to it often holds the true signal.
Organizing Results With Charts and Tables
Numbers mean little until they are arranged into patterns. A table of daily weight measurements from your waste management science project becomes useful only when columns align with the variables you actually controlled. I often sketch the table before the experiment begins.
Charts work differently. They expose trends that rows and columns hide. A line graph of temperature shifts may show a spike on day four, and that spike might match the moment leachate production changed. Your interpretation should link such events, not isolate them.
The choice between tables and charts depends on what you need to see.
- Tables hold raw numbers and keep every variable visible side by side
- Charts expose trends that columns hide
- Anomalies appear as deviations and demand explanation
A waste management science project depends on clear records. A well structured table saves hours of confusion later in the analysis.
Sharing Results and Extending the Projects Reach
Designing a Clear Visual Display
After months of patient observation, the data from our waste management science project finally showed clear patterns. Sharing results makes raw numbers meaningful. A clear visual display connects laboratory work to public understanding. We chose a tri-fold board, but the real strength was in simplicity.
Consider the core elements that made our display effective:
- Before and after photographs of each material sample
- A line graph tracking mass loss over time
- Short captions explaining unexpected findings
Each element helped viewers see the changes. The graph carried the most detail; the photos provided evidence. Without a coherent arrangement, even strong conclusions lose their effect. Extending the project’s reach means designing a display that invites questions, not confusion. Let the visuals present information directly, and the audience will stay engaged.
Explaining the Public Health Benefits
After the display, we took the waste management science project beyond the classroom. We invited neighbours to the final presentation. The public health benefits were visible in the data.
These points resonated with our audience:
- Less decomposing waste reduces fly populations and the diseases they carry.
- Proper sorting stops sharp objects from reaching landfill, protecting waste pickers.
- Composting prevents leachate from polluting groundwater.
In our community, where waste collection is irregular, reducing exposure to pathogens is essential. We handed our charts to a local clinic, and they now use them in their own waste management science project outreach. Sharing results turned a school experiment into a small public health intervention. The message spread because people saw how decomposition affects their own water and air.
Advocating for Better Recycling Habits
Sharing results transformed the waste management science project into something neighbours began to own. The response surprised us! A local school asked for our decomposition charts. A spaza shop owner requested copies to display near her bins. Each request carried the same question: what can we do differently?
We answered by collecting practical habits into a simple list:
- Rinse containers before sorting to reduce odours.
- Keep organic waste in a sealed bucket for the compost pile.
- Set up a weekly drop-off point for glass and paper.
This work multiplies quietly. Our waste management science project now appears in clinic waiting rooms and classroom corridors. Neighbours debate composting timelines at the taxi rank. The sorting habit spreads without lectures.
Developing a Long-Term Community Follow-Up
Three months after the charts went up, the waste management science project had changed. What began as a school display became a community reference point. The clinic requested updated posters. The taxi rank asked for a quarterly waste calendar. Each request pushed us to look beyond the original experiment.
Long term follow up means returning to the same people with new information. We visit the spaza shop every second Friday. We compare bin weights with the neighbourhood committee. We track how many households rinse containers and separate glass.
- Record monthly participation numbers
- Photograph bin conditions at the drop off point
- Interview residents about sorting habits
This data feeds back into the waste management science project. The follow up turns one experiment into a record of community change.
Connecting the Experiment to Real-World Policies
In the three months of data collection, the monthly participation numbers told a story that graphs alone couldn’t capture. We presented these figures at a local ward councillor’s office, and the conversation shifted from classroom theory to municipal practise. The waste management science project had produced a record of bin weights and rinsing habits that aligned with the city’s upcoming by-law review on separation at source.
Our presentation to the council focused on specific outcomes from the drop off point. We included photographs of bin conditions alongside participation trends. The councillor requested a summary of our findings to attach to the agenda for the next portfolio committee meeting.
- Recorded a 23% increase in glass recycling participation over the quarter.
- Documented a measurable reduction in contamination levels at the collection site.
- Noted resident feedback regarding the clarity of the visual display charts.
The connection to real-world policies became concrete when the municipality used our data to support a pilot project for kerbside separation in our suburb. That pilot now references the same indicators we measured, which means the waste management science project continues to inform decisions beyond its original scope. We are no longer just studying waste; we are watching our findings shape regulation in real time.
Exploring Advanced Research Opportunities
Once we shared our results beyond the classroom, the waste management science project started generating genuine interest. Residents began asking for monthly summaries. A local environmental forum invited us to present. The data moved from charts into conversations that shaped behaviour at household level!
Advanced research opportunities now sit within reach. We could measure seasonal variation in recycling habits. We could track how contamination changes after targeted educational drives. We could even compare our suburb’s data with neighbouring wards to identify systemic patterns.
- Analyse moisture content in organic waste streams
- Study the effect of bin colour on sorting accuracy
- Model the financial savings from reduced landfill contributions
Each option extends the waste management science project into territory that matters for municipal planning. The work is no longer confined to a school term.

0 Comments